This study investigates the impact of micro-arc oxidation (MAO) time on the properties of ceramic coatings formed on 7A04 super-hard aluminum alloy. 7A04, an Al-Zn-Mg-Cu system alloy, is prized for its high strength and used in aerospace applications, but suffers from limitations in hardness, wear resistance, and corrosion resistance. MAO, a surface treatment technique, offers a promising solution by creating a ceramic coating that enhances these properties. ceramic coatings are a type of protective layer applied to surfaces, often to enhance their durability, resistance to wear and corrosion, and aesthetic appeal. They are composed of advanced ceramic materials, These can include oxides (like alumina or zirconia ceramic ), carbides (like silicon carbide ceramic ), nitrides (like titanium nitride ceramic ), and other compounds.
This research focuses on optimizing the MAO process by varying the oxidation time and analyzing its effects on the resulting film’s morphology, phase composition, thickness, hardness, and adhesion.
1. Materials and Methods
-
1.1 Test Materials: The substrate material was 7A04 super-hard aluminum alloy, machined into samples of φ20mm x 6.0mm. The chemical composition of the alloy is detailed in Table 1 (omitted from the original text but should be included in the full paper).
Table 1: Chemical Composition of 7A04 Aluminum Alloy 7A04 (wt.%)
| Element | Zn | Mg | Cu | Si | Fe | Mn | Cr | Ti | Ni | Al |
|---|---|---|---|---|---|---|---|---|---|---|
| Content (wt.%) | 6.2 | 2.9 | 2.0 | ≤0.4 | ≤0.5 | 0.3 | 0.28 | 0.2 | <0.05 | Balance |
-
1.2 Micro-arc Oxidation Test: Samples were polished, degreased with alcohol and acetone, and then dried. The MAO process was conducted in a mixed electrolyte solution containing 8g/L sodium aluminate, 1g/L sodium hydroxide, 3g/L boric acid, and 8g/L triethanolamine. The electrolyte temperature was maintained at (20 ± 5)°C using circulating cooling water and a magnetic stirrer. A MAOI-50 power supply was used, with process parameters as listed in Table 2 (omitted from the original text but crucial for reproducibility). The oxidation time was varied systematically: 0, 20, 30, 40, 50, and 60 minutes. Samples were labeled AT0, AT1, AT2, AT3, AT4, and AT5, respectively, corresponding to the different oxidation times.
Table 2: Micro-arc oxidation test parameters of 7A04 aluminum alloy
| Parameter | Value |
|---|---|
| Positive Current Density / (A·dm⁻²) | 10 |
| Negative Current Density / (A·dm⁻²) | 8 |
| Positive Duty Cycle (%) | 20 |
| Negative Duty Cycle (%) | 15 |
| Pulse Frequency / Hz | 200 |
-
1.3 Microstructure Observation and Performance Testing:
- Morphology: Surface and cross-sectional morphology of the ceramic coatings were examined using a S-4700 scanning electron microscope (SEM).
- Phase Composition: Phase analysis was performed using a D/max-2200VPC X-ray diffractometer (XRD).
- Thickness: Coating thickness was measured using a DUALSCOPE MP0 coating thickness gauge.
- Hardness: Micro-hardness was measured using an HXS-1000A digital micro-hardness tester.
- Adhesion: The bonding force between the coating and the substrate was evaluated using a WS-2005 automatic scratch tester.
2. Results and Analysis
-
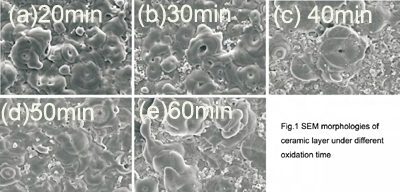
2.1 Influence of Oxidation Time on Film Morphology (Figure 1): SEM analysis revealed a “volcanic crater-like” morphology on the film surface, characterized by micropores and accumulated flake-like substances, indicative of dielectric breakdown. Initially, increasing oxidation time (20-40 minutes) led to an increase in micropore size and the number of discharge channels (Figures 1a-c). However, further increasing the time (50-60 minutes) resulted in a decrease in the number of micropores, with their bases exhibiting a closed morphology (Figures 1d-e). This suggests a reduction in arc points and closure of discharge channels as the reaction progresses. Optimal surface formation was observed at 50 minutes.

-
2.2 Influence of Oxidation Time on Phase Composition (Figure 2): XRD analysis showed the presence of γ-Al₂O₃, α-Al₂O₃, and Al (from the substrate) in the coatings. γ-Al₂O₃ was the dominant phase, with a smaller amount of α-Al₂O₃. The presence of Al peaks confirms the in-situ growth of the ceramic layer on the aluminum substrate. The lower α-Al₂O₃ content is attributed to the high Zn content in the 7A04 alloy, which inhibits the transformation of γ-Al₂O₃ to α-Al₂O₃, despite the high plasma temperatures (3000-10000K) reported in the literature . This inhibition is consistent with previous research.

-
2.3 Influence of Oxidation Time on Film Thickness (Figure 3): Film thickness increased with increasing oxidation time, but the growth rate decreased. The initial rapid growth is attributed to the thin film and numerous discharge channels, facilitating rapid and uniform film formation. As the film thickens, it hinders further discharge into the substrate, increasing resistance and slowing down the growth rate .

-
2.4 Influence of Oxidation Time on Film Hardness (Figure 4): Micro-hardness initially increased with oxidation time, reaching a maximum of 1210 HV0.1 at 50 minutes, and then decreased. The initial increase is due to the formation of a dense oxide film, increasing thickness, and changes in component/crystalline phase content. The subsequent decrease is attributed to increased voltage, larger discharge sparks, and the formation of a loose layer of molten material ejected from the discharge channels, forming crater-like protrusions and reducing surface hardness .

-
2.5 Influence of Oxidation Time on Film Adhesion (Figure 5): The critical load for coating failure increased with oxidation time, from 15.76N to 25.41N, indicating improved adhesion. This is related to the increasing film thickness, higher breakdown voltage, increased reaction energy, and the formation of a stronger metallurgical bond between the coating and the substrate. The increased α-Al₂O₃ content at longer oxidation times also contributes to higher film hardness and strength, further improving adhesion [19].
3. Conclusions
-
The MAO coating on 7A04 aluminum alloy exhibits a “volcanic crater-like” morphology. Micropore size and number initially increase with oxidation time, then decrease and close. Optimal surface formation occurs at 50 minutes.
-
The coating consists primarily of γ-Al₂O₃ with a small amount of α-Al₂O₃.
-
Film thickness increases with oxidation time, but the growth rate decreases. Hardness initially increases and then decreases, with a maximum of 1210 HV0.1 at 50 minutes.
-
Adhesion between the coating and substrate increases significantly with oxidation time, from 15.76N to 25.41N.
This study provides valuable insights into the optimization of MAO parameters for 7A04 aluminum alloy. The results demonstrate that controlling the oxidation time is crucial for tailoring the properties of the ceramic coating to meet specific application requirements. Further research could explore the influence of other MAO parameters, such as current density and electrolyte composition, to further optimize the process and enhance the performance of the coated components.